How to get started
Having identified and considered what you are aiming to improve, this section sets out how to get organised, understanding the current situation, familiarisation with relevant improvement literature and aligning with drivers for change in your service.
Here is a simple guide from Walsall Healthcare NHS Trust to setting up and managing a quality improvement project within a service or department:
https://www.walsallhealthcare.nhs.uk/wp-content/uploads/2021/11/QI-project-How-to-guide_.pdf
Understand the issues
It is important to understand what is already known and what approaches have been tried so that you can build on this as you start to plan your improvement intervention. A literature search does not need to be exhaustive but a search on the most likely journals to cover the issues (for QI theory and research see BMJ Quality & Safety, for ideas from QI project reports see BMJ Open Quality), plus the main relevant professional websites are likely to generate quick results.
It’s then time to look into the issues within your service in more depth. Exploratory approaches include process mapping to understand the current situation, where the process is efficient with no more steps than necessary and illustrating where there are bottlenecks, duplication and uncertainty of the process to follow.
This example from the NHS England NHS Improvement guide to process mapping works through all the stages for anticoagulant blood testing in a hospital setting:
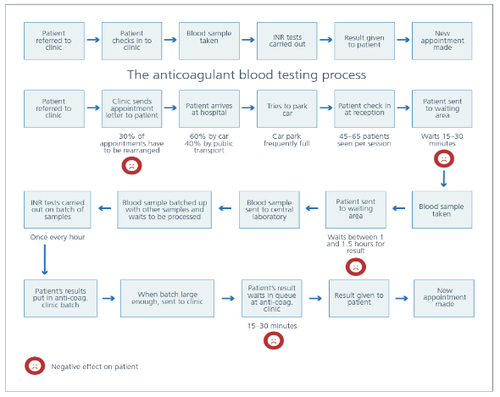
More details on how to plan and carry out a process mapping exercise can be found in the complete guide, available through this link: NHS England guide to process mapping
Using a fishbone diagram also called cause-and-effect diagram, or Ishikawa diagram after its creator Professor Kaoru Ishikawa in the 1960s, helps to look at what the underlying causes of the problem issue may be, helping to direct the design of the improvement intervention. A fishbone diagram is a visual way to explore causes and effects, using generic headings, such as; materials, communication, policies, environment, people, data and measurement.
This worked up example from the Clinical Excellence Commission of New South Wales explores the causes and effects for why patients may not be prescribed the correct anti-coagulant dose:
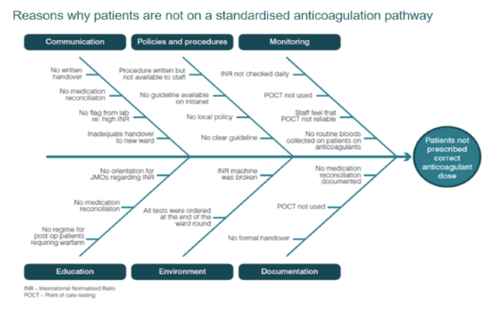
Find more information in this guide from the NHS England Online library of Quality, Service Improvement and Redesign tools, Cause and effect (fishbone) diagram: https://www.england.nhs.uk/wp-content/uploads/2021/12/qsir-cause-and-effect-fishbone.pdf